As many customers are moving to a hybrid cloud environment, where they run servers and applications not just in Microsoft Azure, but also on-premises, at the edge, or even in a multi-cloud environment, Azure Arc can provide them with a single control plane to manage all of these servers. One of the management capabilities you can enable for servers running outside of Azure Arc is monitoring and insights. With monitoring and insights for your, Azure Arc enabled servers, you can use Azure Monitor to keep control of your hybrid environment directly from Azure. In this blog post, we are going to have a quick look at how you can leverage Azure Monitor for monitoring and insights for your Azure Arc enabled servers.
Before you can get started to use the monitoring and insights feature for your servers, you will need to add the server to Azure Arc and deploy the Azure Monitoring Agent. You can also learn more about the new extensions in my video. You can connect your hybrid servers running Linux or Windows Server, running on-premises, at the edge, or even another cloud provider.
Monitoring and Insights for Azure Arc enabled Servers using Azure Monitor
After you have connected the server, which can be a Windows Server or a Linux server, you can enable Insights within the Azure portal. Just navigate to the Azure Arc enabled servers and on the menu, you can find insights. Here you can now find Azure Monitor tools like the dependency map to view a map directly from a VM or view a map from Azure Monitor to see the components across groups of VMs.
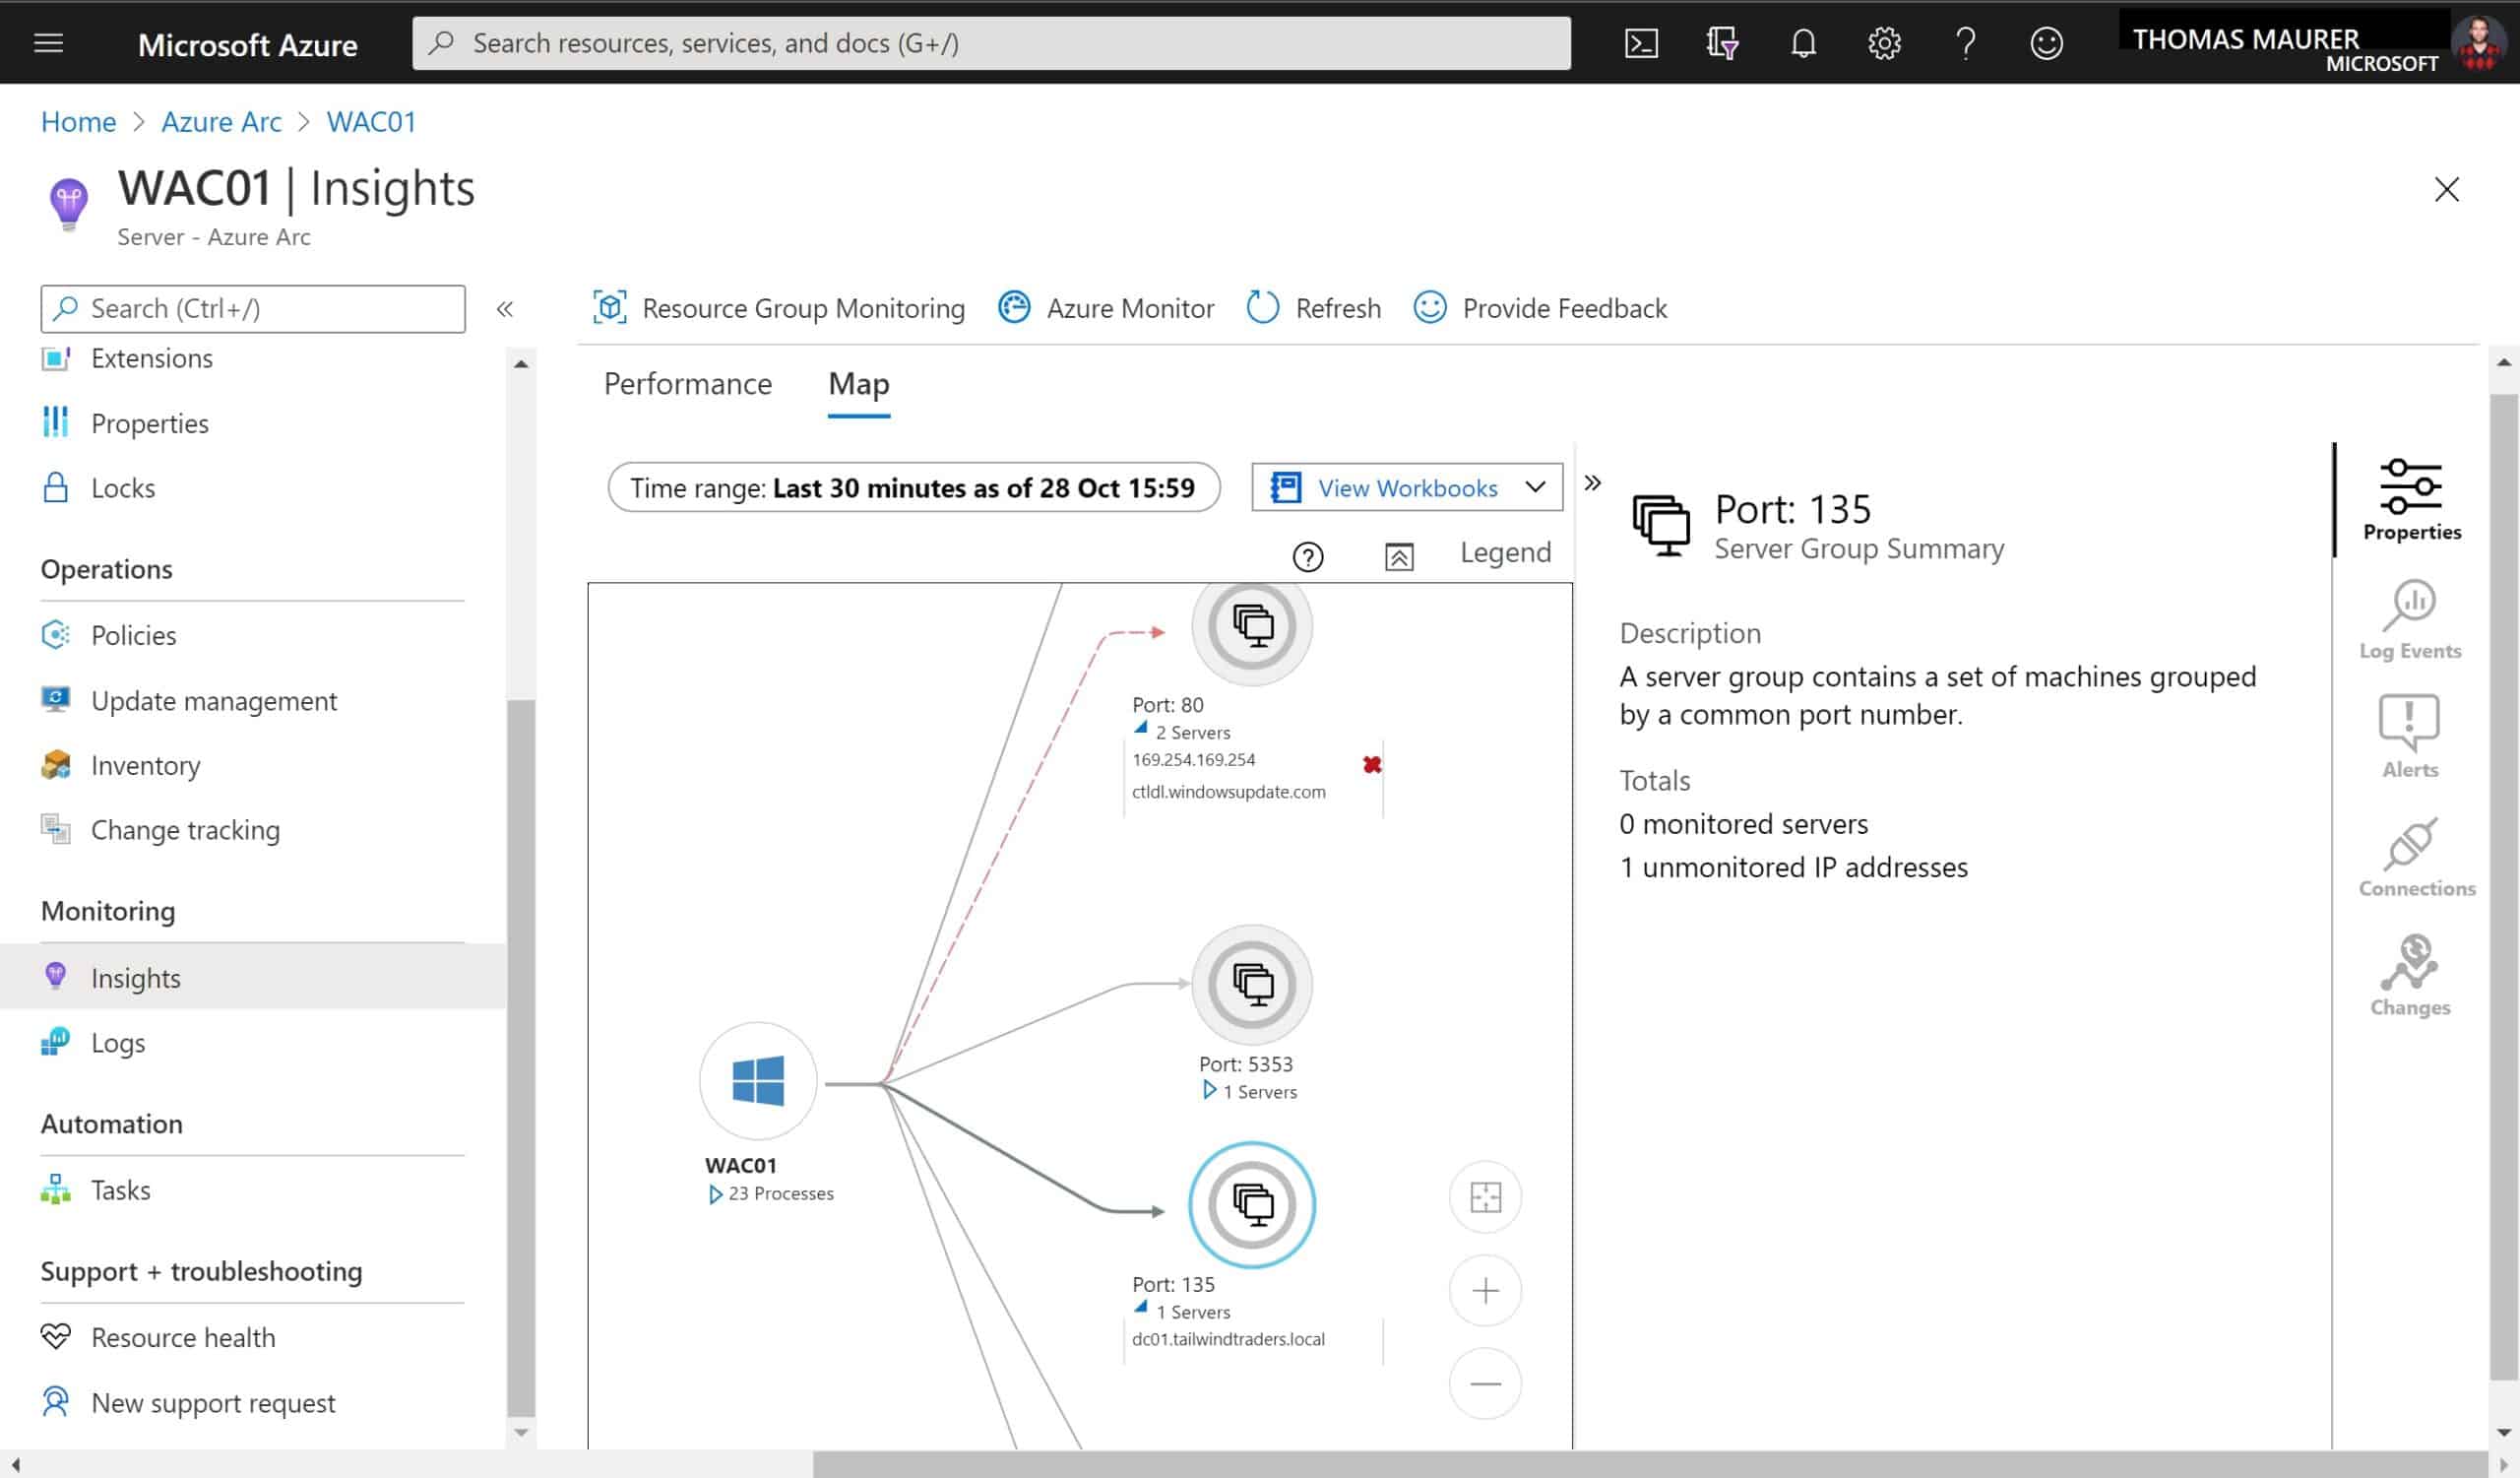
Azure Arc Enabled Server Monitoring and Insights Dependency Map
You can learn more about dependency maps in Azure Monitor on Microsoft Docs.
Another part of insights for your Azure Arc enabled servers is performance monitoring. Azure Monitor includes a set of performance charts that target several key performance indicators (KPIs) to help you determine how well a virtual machine is performing. The charts show resource utilization over a period of time so you can identify bottlenecks, anomalies, or switch to a perspective listing each machine to view resource utilization based on the metric selected.

Azure Arc Enabled Server Performance Monitoring
The following capacity utilization charts are provided:
- CPU Utilization % – defaults showing the average and top 95th percentile
- Available Memory – defaults showing the average, top 5th, and 10th percentile
- Logical Disk Space Used % – defaults showing the average and 95th percentile
- Logical Disk IOPS – defaults showing the average and 95th percentile
- Logical Disk MB/s – defaults showing the average and 95th percentile
- Max Logical Disk Used % – defaults showing the average and 95th percentile
- Bytes Sent Rate – defaults showing average bytes sent
- Bytes Receive Rate – defaults showing average bytes received
You can learn more about performance monitoring in Azure Monitor on Microsoft Docs.
If you want to learn more about Azure Arc enabled servers monitoring, I recommend that you follow the Tutorial: Monitor a hybrid machine with Azure Monitor for VMs.
I hope that quick blog post provide you with an overview about monitoring and insights for Azure Arc enabled servers in a hybrid cloud environment. If you have any questions, feel free to leave a comment.
Tags: Arc, Azure, Azure Arc, Azure Arc Enabled Server, Dependency Map, Hybrid Cloud, Insights, Linux, Microsoft, Microsoft Azure, Monitor, Monitoring, performance, Server, Windows Server Last modified: October 29, 2020